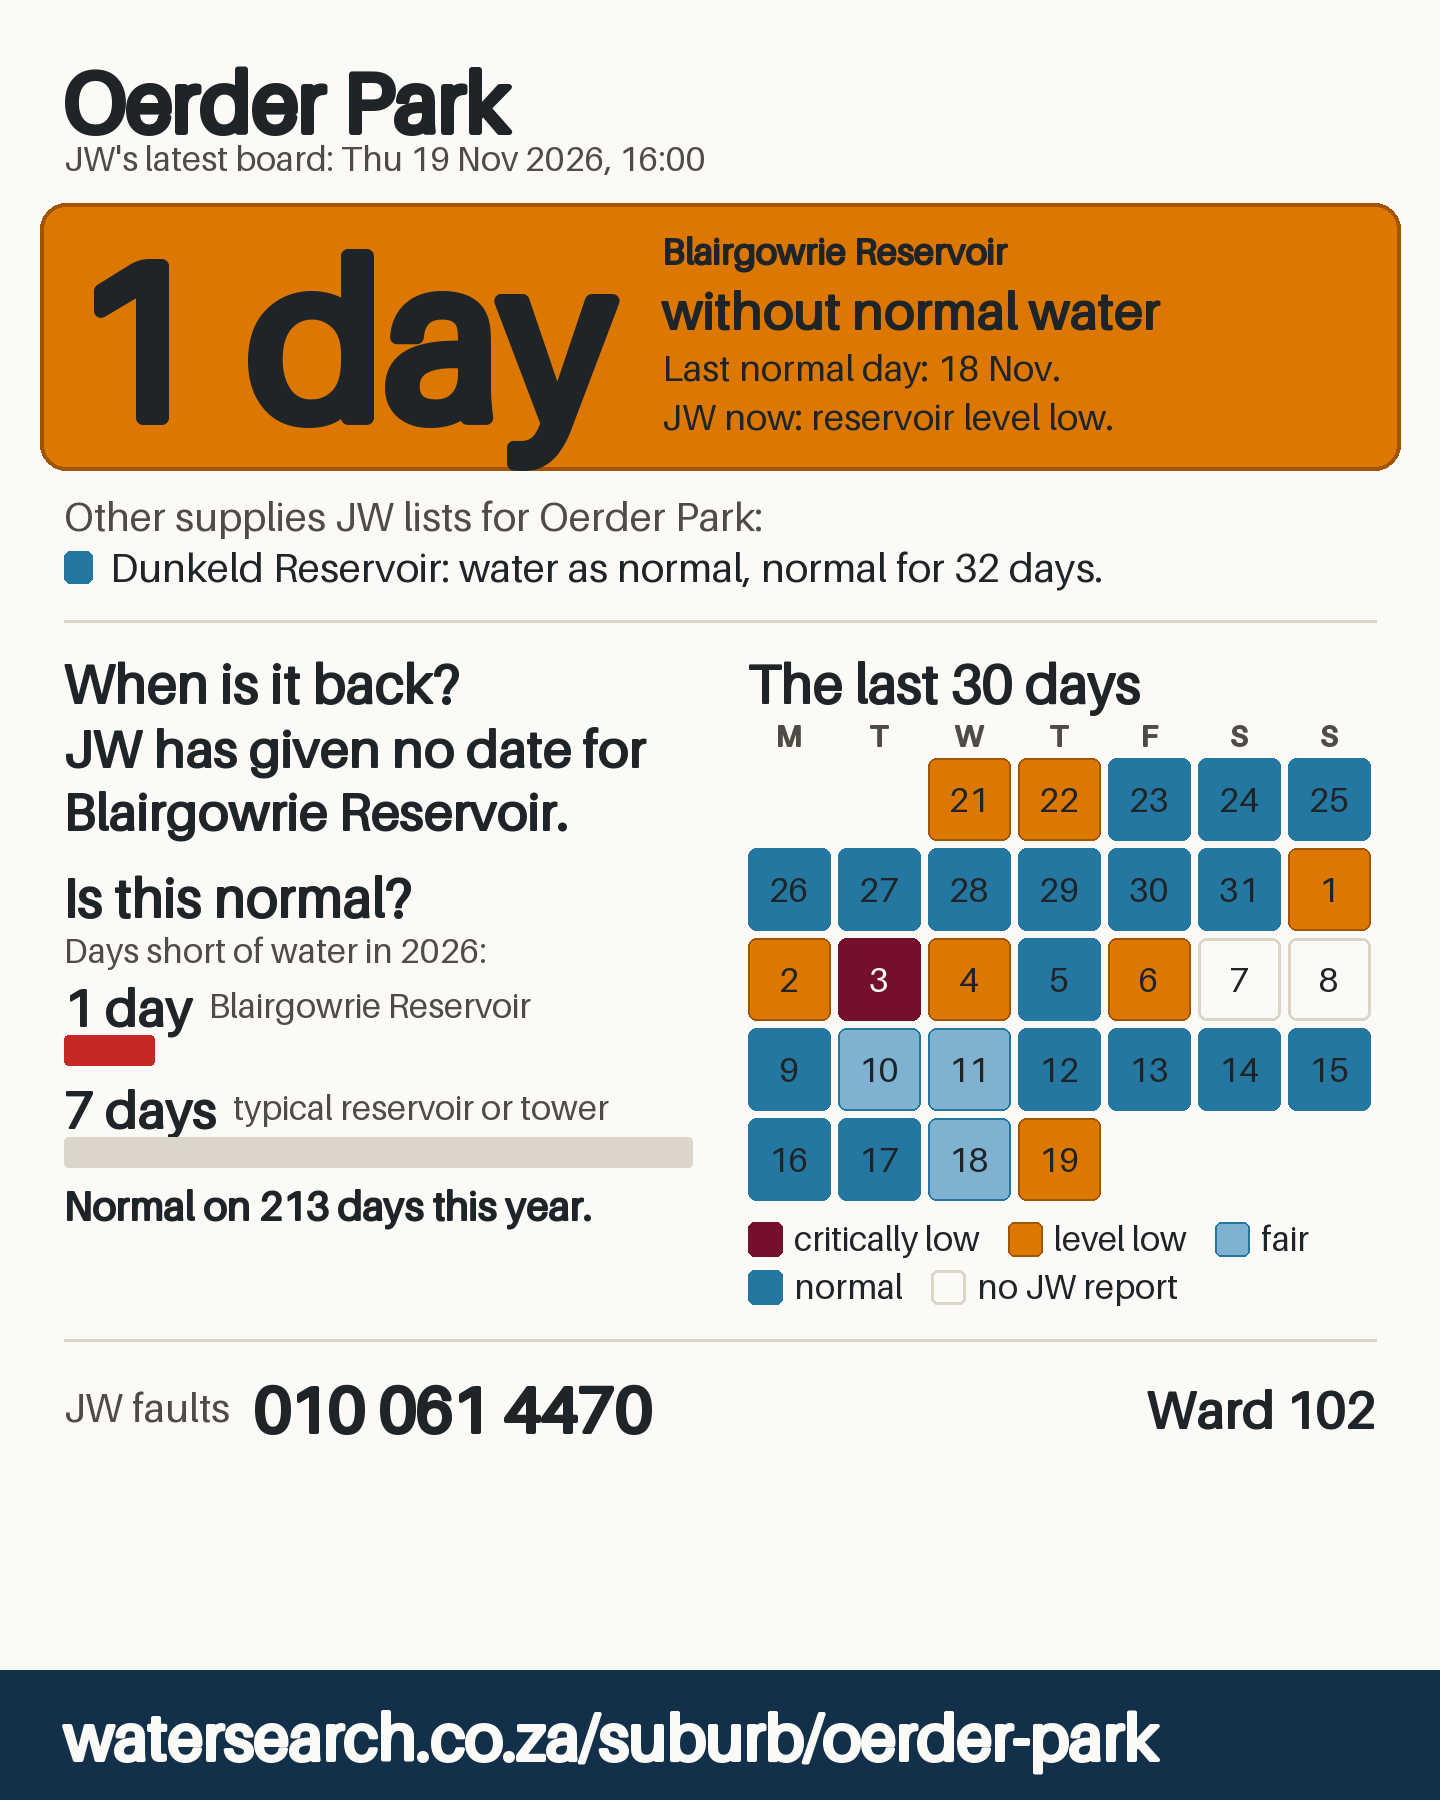
In 2026 so far: 1 day short of water for Blairgowrie Reservoir, from 230 days with a report; 0 days for Dunkeld Reservoir, from 231. A typical supply in the city, the median one (half had fewer), had 7 days.
Each square is a day, as JW reported it for a supply: a reservoir or tower that JW reports on. The number at the right is the month's days short of water.
In 2026 so far, JW reported at least one of Oerder Park's 2 supplies short of water on 1 day
3 March 2025 to 19 November 2026, from 563 days with a JW report.
Dunkeld Reservoir
In 2026 so far: 0 days short of water, from 231 days with a JW report.
11531short
2025
Mar0
Apr0
May0
Jun0
Jul4
AugNo JW boards, Aug 2025 to Jan 2026
2026
Feb0
Mar0
Apr0
May0
Jun0
Jul0
Aug0
Sep0
Oct0
Nov0
Blairgowrie Reservoir
In 2026 so far: 1 day short of water, from 230 days with a JW report.
11531short
2025
MarNo JW boards, Mar to Apr
May0
Jun0
Jul0
AugNo JW boards, Aug 2025 to Jan 2026
2026
Feb0
Mar0
Apr0
May0
Jun0
Jul0
Aug0
Sep0
Oct0
Nov1
water as normal
supplying fairly
JW warned
low, or weak in places
short of water
critically low
shut for the night
no JW report
still filling in
JW's reported status of the reservoir or tower, not measured water at taps. Boards from March 2025.
Source: Johannesburg Water's System Update boards and notices, read by us. How this record is made.
Cite this figure
watersearch (2026). “In 2026 so far, JW reported at least one of Oerder Park's 2 supplies short of water on 1 day”. Data release 2026-11-19-f2f862b0. https://watersearch.co.za/suburb/oerder-park#fig-year
The data as a table
Supply
Month
Days reported
Days in record
Adequate or fair
Poor pressure in places, or low
Warning: no water may occur
Poor pressure to no water
Critically low
Overnight closure
Dunkeld Reservoir
March 2025
18
29
18
0
0
0
0
0
Dunkeld Reservoir
April 2025
12
30
12
0
0
0
0
0
Dunkeld Reservoir
May 2025
12
31
12
0
0
0
0
0
Dunkeld Reservoir
June 2025
28
30
28
0
0
0
0
0
Dunkeld Reservoir
July 2025
23
31
19
0
0
1
3
0
Dunkeld Reservoir
August 2025
0
31
0
0
0
0
0
0
Dunkeld Reservoir
September 2025
0
30
0
0
0
0
0
0
Dunkeld Reservoir
October 2025
0
31
0
0
0
0
0
0
Dunkeld Reservoir
November 2025
0
30
0
0
0
0
0
0
Dunkeld Reservoir
December 2025
0
31
0
0
0
0
0
0
Dunkeld Reservoir
January 2026
0
31
0
0
0
0
0
0
Dunkeld Reservoir
February 2026
7
28
7
0
0
0
0
0
Dunkeld Reservoir
March 2026
21
31
21
0
0
0
0
0
Dunkeld Reservoir
April 2026
30
30
30
0
0
0
0
0
Dunkeld Reservoir
May 2026
31
31
31
0
0
0
0
0
Dunkeld Reservoir
June 2026
30
30
30
0
0
0
0
0
Dunkeld Reservoir
July 2026
30
31
30
0
0
0
0
0
Dunkeld Reservoir
August 2026
20
31
20
0
0
0
0
0
Dunkeld Reservoir
September 2026
21
30
21
0
0
0
0
0
Dunkeld Reservoir
October 2026
25
31
25
0
0
0
0
0
Dunkeld Reservoir
November 2026
16
19
16
0
0
0
0
0
Blairgowrie Reservoir
March 2025
0
29
0
0
0
0
0
0
Blairgowrie Reservoir
April 2025
0
30
0
0
0
0
0
0
Blairgowrie Reservoir
May 2025
2
31
2
0
0
0
0
0
Blairgowrie Reservoir
June 2025
1
30
1
0
0
0
0
0
Blairgowrie Reservoir
July 2025
6
31
5
0
0
0
0
1
Blairgowrie Reservoir
August 2025
0
31
0
0
0
0
0
0
Blairgowrie Reservoir
September 2025
0
30
0
0
0
0
0
0
Blairgowrie Reservoir
October 2025
0
31
0
0
0
0
0
0
Blairgowrie Reservoir
November 2025
0
30
0
0
0
0
0
0
Blairgowrie Reservoir
December 2025
0
31
0
0
0
0
0
0
Blairgowrie Reservoir
January 2026
0
31
0
0
0
0
0
0
Blairgowrie Reservoir
February 2026
7
28
7
0
0
0
0
0
Blairgowrie Reservoir
March 2026
19
31
19
0
0
0
0
0
Blairgowrie Reservoir
April 2026
30
30
30
0
0
0
0
0
Blairgowrie Reservoir
May 2026
31
31
27
2
0
0
0
2
Blairgowrie Reservoir
June 2026
28
30
28
0
0
0
0
0
Blairgowrie Reservoir
July 2026
30
31
30
0
0
0
0
0
Blairgowrie Reservoir
August 2026
21
31
21
0
0
0
0
0
Blairgowrie Reservoir
September 2026
21
30
16
5
0
0
0
0
Blairgowrie Reservoir
October 2026
26
31
24
2
0
0
0
0
Blairgowrie Reservoir
November 2026
17
19
11
5
0
0
1
0
A day counts as short of water when JW's worst report for it that day was “poor pressure to no water” or “critically low”, as happening or expected (expected most often means higher streets). A warning that it may occur does not count.
In short
The latest JW report on this site is from 19 November 2026. Blairgowrie Reservoir was low. Dunkeld Reservoir had water as normal. JW reported Blairgowrie Reservoir and Dunkeld Reservoir short of water on 1 and 0 days this year. A typical reservoir or tower in the city had 7 such days. On Blairgowrie Reservoir, its one outage lasted 23 hours.
Oerder Park in the 2026 wards: Ward 102. Ward boundaries: Municipal Demarcation Board, 2026.
Outages
JW reported 3 outages on Oerder Park's supplies since March 2025. The longest lasted 2 days. Every outage, with how long it lasted: Blairgowrie Reservoir and Dunkeld Reservoir.
JW's end dates
JW posted 10 notices with an end date that list a suburb or system Oerder Park's supplies feed. Most name only suburbs, not the reservoir or tower, so the summary at the top uses only a notice that names the supply itself. By the stated time JW's boards showed the water back on none of the 19 end times that have passed. Each end date against what happened: Blairgowrie Reservoir and Dunkeld Reservoir.
Under strain
In 2026 so far, Oerder Park had 15 days under strain: days when JW reported any of its supplies low or worse, or warned that higher-lying areas may lose water. This is a wider count than days short of water.
The network is linked. Oerder Park draws on all its supplies at once, and when one runs low the others carry more. At such times JW's boards sometimes warn of “poor pressure to no water in higher-lying areas”: under strain, higher streets lose water first. JW does not say which streets those are.
What JW's boards cannot tell you
JW's boards report reservoirs and towers, so some things are not in this record:
Whether water reaches your street or your tap.
Which streets lose water first: JW warns of higher-lying areas but does not name the streets.
Why a supply ran low, unless a JW notice gives a reason.
Pipe bursts, tankers and valve work, which are not on the boards.